Tuatara Headline Signal — Hourly Return Curve
Equal-weight directional return of the Tuatara vector basket, sampled every hour for 72 hours after a news headline, aggregated across 321 tradeable headlines. Causal entry at the headline timestamp; BTC is the benchmark.
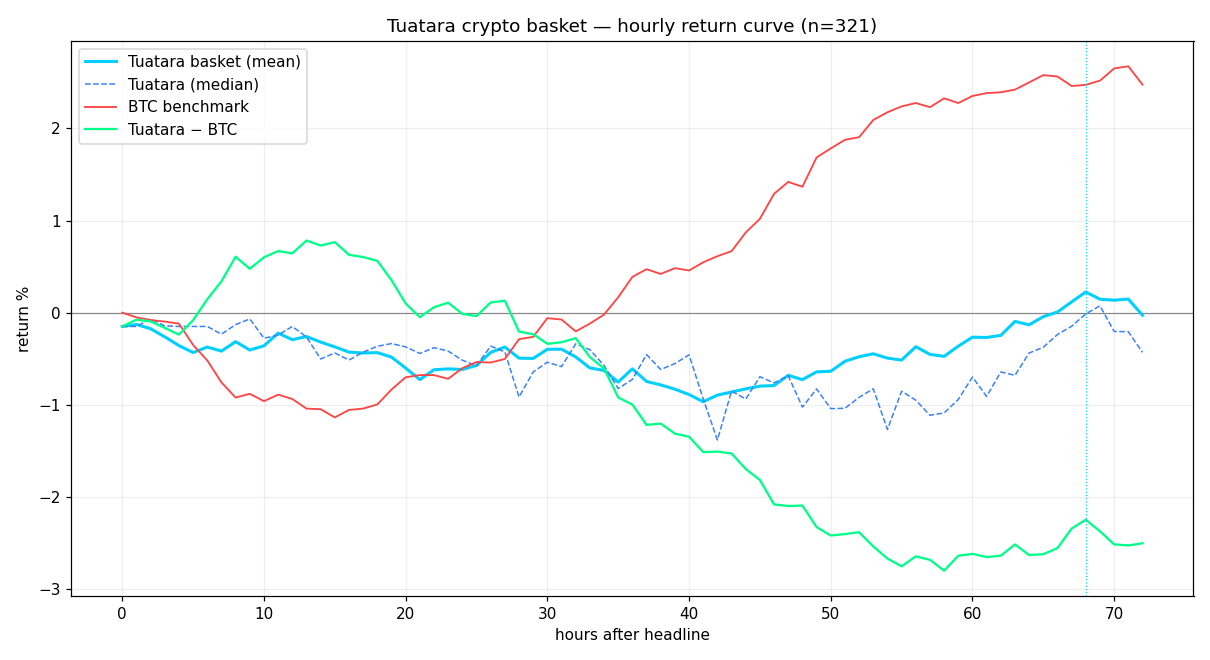
Where the alpha lives. The signal’s edge over the market (Tuatara − BTC, green) is
front-loaded: it peaks at +0.78% around 13 hours and is positive only in the
~6–20 hour band, then decays to −2.5% by 72h as BTC rallies and the basket lags.
For market-neutral / long–short use, the optimal hold is ~12–18 hours, not days — the daily
backtest’s “2–3 day” best hold was capturing BTC beta, not signal.
Return by hold time
| Hold (h) | Basket mean % | vs BTC % | Win % | n |
|---|---|---|---|---|
| 1 | −0.13 | −0.08 | 39.4 | 193 |
| 6 | −0.37 | +0.15 | 44.3 | 192 |
| 12 | −0.29 | +0.64 | 43.8 | 192 |
| 13 ◄ peak alpha | −0.26 | +0.78 | 43.8 | 192 |
| 18 | −0.43 | +0.56 | 45.8 | 192 |
| 24 | −0.62 | −0.01 | 43.6 | 202 |
| 36 | −0.61 | −1.00 | 42.7 | 192 |
| 48 | −0.73 | −2.09 | 41.6 | 202 |
| 72 | −0.03 | −2.50 | 46.5 | 202 |
Method
Cymetica · Tuatara vector research · signal/research only, not investment advice ·
cymetica.com